tradestation.gif
 

"WOLFE WAVES"
INDICATOR


by BILL WOLFE
From "STREET SMARTS" Book

Written in EasyLanguage Code
for the TradeStation / Supercharts Platform
(.ELS FILE) + Instructions + BONUS (See Below)
 

*** THE CODE WILL BE DOWNLOADED
IN ZERO TIME ! EVEN IN THE NIGHT ! ***


" This particular methodology is perhaps the most unique, effective trading technique I've ever come across! It was developed and shared by a good friend, Bill Wolfe, who for the last 10 years has made a living trading the S&P His son, Brian, also trades it. Brian was the first teenager I've ever met who consistently made a good income scalping NYFE (Knife) futures from his apartment. Brian, now 21, has expanded into trading the Wolfe Wave in other markets.

Bill's theory of wave structure is based on Newton's first law of physics: for every action there is an opposite reaction. This movement creates a definite wave with valuable projecting capabilities. This wave most clearly sets up when there is good volatility. With a bit of practice, it is easy to train your eye to spot these patterns instantly. "


Examples:

:

HOW THE SETUP WORKS


Rules for Bullish WolfeWave Structure:


Please note the odd sequence in counting, as you will see, it is necessary for the

inductive analysis.  By starting with a top we are assured of beginning our count on a

new wave.  (The reverse would apply for a bearish wave.)


The 2 point is a top.

The 3 point is the bottom of the first decline.

The 1 point is the bottom prior to point 2 (top), that 3 has surpassed.

The 4 point is the top of the rally after point 3.

The 5 point is the bottom after point 4 and is likely to exceed the

            extended trend line of 1 to 3.

            This is the entry point for a ride to the EPA line (1 to 4).

Estimated Price at Arrival (EPA) is trend line of 1 to 4 at apex of

            extended trend line of 1 to 3 and extended trend line of 2 to 4.

Estimated Time of Arrival (ETA) is apex of extended trend line of 1 to 3 and 2 to 4.


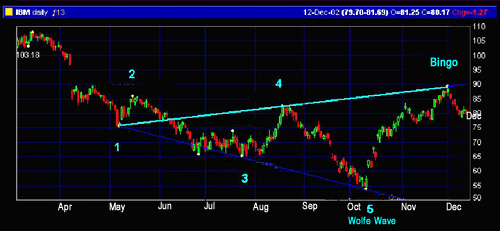
THE WOLFE WAVES INDICATOR IN ACTION !


THE WOLFE WAVES INDICATOR STILL IN ACTION ! 


Here is what you get:


WOLFE WAVES INDICATOR (.ELS)
Setup Details


Now Get the WOLFE WAVES EasyLanguage
code from the Conners/Raschke "STREET SMARTS" book.
Code is compatible with all versions of TradeStation / SuperCharts and is
open source for studying and upgrading.


BUY IT FOR $ 99


You can Pay by
PAYPAL or CreditCards
The Code Can Be Downloaded in Zero Time. No Shipping Fees!
for ANY Question just email me at:
info@forexvipclub.com


***FREE BONUS #1***

FREE WEBINAR by Linda Bradford Raschke on
CLASSIC SWING TRADING
in It's Purest Technical Form


***FREE BONUS #2***


FREE WEBINAR by Linda Bradford Raschke on

Tricks on Trading the FIRST 30 Minutes


***FREE HUGE BONUS #3***

This is a $637.07 value, but it's yours FREE!

A collection of classic 10 E-Books on Wealth Development, Goal Setting, Internet Marketing, and Real Estate.

Yours for FREE!

  • "The Science of Getting Rich" - by Wallace Wattles, a classic book for wealth development.
  • "Think and Grow Rich" - by Napoleon Hill, who spent over 20 yrs, studying successful entrepreneurs of that time, i.e. Thomas Edison, Henry Ford, Andrew Carnegie, Charles Schwab, and 500 others, to find the common denominator of success, which he put in this best-seller.
  • "Road To Wealth" - by Robert Allen, best-selling author of numerous books, including "Nothing Down", and "The Enlightened Millionaire".
  • "Success Principles" - by Jack Canfield (co-author of "Chicken Soup for the Soul") and Janet Switzer.  This Workbook will walk you through the success maze, with excercises and an action game plan for the next 30 days.
  • "Million Dollar Emails" - created by multiple authors including Robert Allen, Joe Vitale, Jeff Paul and others.  215 pages of money making emails PLUS Million Dollar Resource Directory.
  • "Robert Allen's Money Power System For Making Your Real Estate Fortune" - 500 pages of real estate strategies, by a real estate guru, and author of best selling "Nothing Down" and "Nothing Down For the 90's".
  • "Nothing Down Real Estate Techniques" - by Robert Allen.
  • "7 Strategies For Making A Fortune Online" - by Robert Allen, learn Super Glue Ways for Finding "Them" and Keeping "Them" coming Back for More.
  • "How to make $24,000 in 24 hours on the Internet!" - by Robert Allen, special report, on how to make money online instantly, by the author of best-selling books, "Creating Wealth", "Nothing Down", "Multiple Streams of Income".
  • "Zero to $1,000,000 on $49.95 a Month" - by Robert Allen, another special report created by a marketing genius.

 I've decided to throw it in FREE as part of this offer because I know these resources will help you accomplish your goals and provide you with the neccessary information to help your start a business or take your existing business to the next level.

Enjoy!


So that there is no risk to you, I also offer a 100%,
no-questions-asked, money-back guarantee.
If you use this TRADESTATION CODE
and you're not convinced it will help you,
I want you to let me know and
I'll give you your money back, no questions asked.


tradestation.gif 


OTHER BLOG ARTICLES:

lunedì 6 luglio 2009

Trading With Wolfe Waves

Wolfe Waves were discovered by a trader by the name of Bill Wolfe after "thirty some odd years of studying". Apart from using some odd english, Mr Wolfe also liked to put his name to existing patterns, as a Wolfe Wave really is no more than a wedge pattern, with a specific wave count to it. Despite this, the Wolfe Wave can be a powerful tool in your naked arsenal, if used in the right context, which I will go into here.

My knowledge on these waves derive from both trading them for "seven some odd years" and the official Wolfe Wave manual written by Bill Wolfe himself. Unfortunately the essence of what a Wolfe Wave is representing is lost in many circles, so hopefully we can clarify things a little.

First of all, what a Wolfe Wave look like, for this, I will let Bill himself show you:

wolfewaves

You can see from these basic example charts, that a Wolfe Wave is essentially an ascending or descending wedge depending on the market conditions (more on that later). For a wedge to be called a Wolfe Wave it must consist of four waves with the end of the fourth wave (marked 5 in the above charts) reaching, or exceeding the wedge pattern extremes.

EPA stands for Estimated Price at Arrival, which doubles as your profit taking line. ETA, stands for Estimated Time of Arrival and should be completely ignored, even Wolfe himself acknowledged that which makes you wonder why he mentioned it at all really. Wolfe's basic premise for trading these patterns is to wait for point 5 to enter a trade, and look for the line marked EPA to be your target, hopefully arriving right on time (ETA).

So that is Wolfe theory out of the way (yep the manual doesn't go into too much more in it's thirty odd pages), but let's look at a real world example, as shown on the cable chart of early December 2008:

4-01-2009-7-40-37-amLooks wonderfully easy in hindsight doesn't it. So why do they work (sometimes)? Wolfe waves work on the psychological frailty of the novice trader. The best Wolfe waves tend to be those that are pointing in the direction of the established trend.

Trends are wonderfully easy to find after they have confirmed themselves with three to four waves. Before that they look like a standard retracement in the previous trends direction. It is only after that retracement fails, that a new trend is suspected, and once a new high/low is set in the opposite direction, it is then we can think a new trend is has formed.

The professional/experienced trader can usually find signs of these developing trends earlier and jump on the departing train. The inexperienced trader, needs multiple confirmations, quite often from various squiggly lines before they agree a trend is in place. The result being increased pressure on the retracements in the final stages of the trend from the late arrivals, meanwhile the big money slowly jumps of the impending train wreck, meaning shallower proportional breaks of new highs and lows.

Really the Wolfe wave is no more than a technique to trade a matured wedge pattern, telling you where to enter, and where to look to take profits. The entry is based on the concept of a final exhaustive run in the direction of the trend, using up the last of the buyers/sellers. Price then reverses suddenly and heads off towards the EPA, which hold similar concepts to the Axis lines I talked about in a previous article.

So how do you trade it. To trade a Wolfe wave consistently you need to recognise the inherent weakness of the technique itself, that is;

  1. You are trying to catch a falling knife.
  2. You are entering after a new high or low has been made, making identifying entry locations difficult.
  3. Your trip to your target is against the previous trend .. making it a bumpy ride at times as people get out of positions.

Below is a visual step through of the above mentioned Wolfe wave trade that I hope will help in visualising their potential, click to get full sized images:

step1 step2
step3step4
step5step6

At times point 4 can be a little messy or ambiguous, such as was this case this time, if that is the case, drawing alternate EPA's can help in finding the best exit point. If you are a conservative trader, you can shoot for the closest EPA, else the more aggressive trader might look for the next EPA:

step7Trading Wolfe waves, or any type of wedge pattern can be a very profitable way to trade. It has you entering during quite times and trying to ride out the powerful moves that follow. The key is patience, to firstly, get the right entry and not jump in too early, second, to stick with the entry while it bobbles around, third to not be shaken out by the odd headfake, and finally to ride that baby for all it's got.

To minimise your entry risk, and maximise your risk reward ratio, look for previous support/resistancein the area of the sweet spot (marked in light grey on the charts), especially if it is from a time frame above what you found the Wolfe Wave on. If that fails, extensions can help to get a general area to look for a price trigger, such as the hammer candle seen in the above chart.

There are more nuances to the Wolfe Wave I have not listed here, but this should get you on your way. If you trade one, or wonder if you are spotting them correctly, throw a post over at the newbeginnertrader {forum}, and if you can, grab a copy of the Wolfe Wave manual if you get a chance to get it straight from the horses mouth.

Advanced Channeling Patterns: Wolfe Waves and Gartleys

Channels provide a simple and reliable way for traders to define their entry and exit points within an equity. Although the basic channel-trading rules provide traders with a good idea of where the price is going within the channel, they leave little insight into where breakouts might occur. Identifying patterns known as Wolfe Waves and Gartleys, however, can help predict these breakouts in terms of both their timing and scope (their proportion to the established channel). This article will take an in-depth look at the channeling techniques centered on these patterns, and how they can be applied to help you profit.

Wolfe Waves
The Wolfe Wave is a natural pattern found in every market. Its basic shape shows a fight for balance, or equilibrium, between supply and demand. This naturally occurring pattern was not invented, but rather discovered as a means to predicting levels of supply and demand.

These patterns are very versatile in terms of time, but they are specific in terms of scope. For instance, Wolfe Waves occur in a wide range of time frames, over minutes or even as long as weeks or months, depending on the channel. On the other hand, the scope can be predicted with amazing accuracy. For this reason, when correctly exploited, Wolfe Waves can be extremely effective.

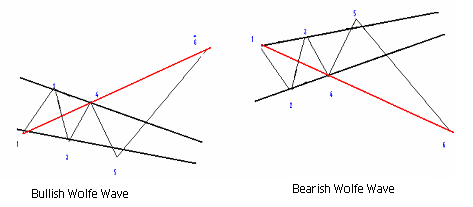
The overriding factor in identifying the Wolfe Wave pattern is symmetry. As shown below, the most accurate patterns exist where, between 1-3-5, there are equal timing intervals between wave cycles.


Figure 1: Bullish Wolfe Wave Pattern Figure 2: Bearish Wolfe Wave Pattern
Source: www.harmonictrader.com

Here are some key points to remember for identifying Wolfe Waves:
  • Waves 3-4 must stay within the channel created by waves 1-2.
  • Waves 1-2 equal waves 3-4 (showing symmetry).
  • Wave 4 revisits the channel of points established by waves 1-2.
  • There should be regular timing intervals between waves.
  • Waves 3 and 5 are usually 127% or 162% (Fibonacci) extensions of the previous channel point.
The pattern can be found in:
  • Rising channels in an uptrend.
  • Falling channels in a downtrend.
  • Level channels during consolidation periods.
Notice that the point at wave 5 shown on the diagrams above is a move slightly above or below the channel created by waves 1-2 and 3-4. This move is usually a false price breakout or channel breakdown, and is the best place to enter a stock long or short. The "false" action at wave 5 occurs most of the time in the pattern, but isn't an absolutely necessary criterion. The point at wave 6 is the target level following from point 5 and is the most profitable part of the Wolfe Wave channel pattern. The target price (point 6) is found by connecting points 1 and 4 (see the red lines in Figures 1 and 2).

Figure 3 is an example of the pattern at work. Remember, wave 5 is an opportunity to take action with a short or long position while the point at wave 6 is the target price.


Figure 3: Chart provided by http://www.chart.nu

It is also important to note that Wolfe Waves, along with most pattern trading strategies, are highly subjective. (For further reading on this kind of subjectivity, see Launching Elliott Wave into the 20th Century.) The key to profiting is accurately identifying and exploiting these trends in real time, which can be more difficult than it sounds. As a result, it is wise to paper trade this technique - as it is any new technique you are learning - before going live. And, remember to use stop losses to limit your losses.

The Gartley
The Gartley trading pattern was created by H.M. Gartley, who first illustrated it in his book "Profits in the Stock Market" (1935). The setup consists of a single large impulse wave followed by two small pullback impulse waves. The diagrams below show examples of the ideal setup, both bullish and bearish. In the bullish example XA represents the first large impulse with a price reversal at A. In accordance with Fibonacci ratios, retracement AB should be 61.8% of the price segment A minus X. This percentage is shown by the segment XB.


Figure 4: Bullish Pattern


Figure 5: Bearish Pattern
Source: www.harmonictrader.com

At point B, the price again makes a smaller impulse opposite to that of A. Ideally, the retracement BC should be between 61.8% and 78.6% of the AB price range, regardless of the the length of the lines. This percentage is shown by segment AC. At C, the price again makes a reversal impulse opposite to that of B. In this pattern, again as stated by Fibonacci ratios, the retracement CD should be between 127% and 161.8% of the range BC, and this proportion is shown along the line BD.

Price D is the optimal point for buying or selling. At entry D the target retracement to a higher price is initially 61.8% of the range of segment CD. The movement from point D to its next point is extremely profitable. Moves from point D are very quick and powerful, and they follow this model accurately 60% or more of the time.

Here are the key points to remember for Gartleys:
  • Ideally, AB equals CD in time length.
  • Point D is a 62-72% pullback from XA.
  • XD should ideally be 78.6% of the segment range XA.
  • Ideally CD equals AB.
  • Take action at point D.
The condition in which these patterns can be found depends on whether they are bullish or bearish:
  • Bullish Gartleys occur in uptrends.
  • Bearish Gartleys occur in downtrends.
Figure 6 demonstrates the bullish Gartley at work. And Figure 7 shows the bearish Gartley:


Figure 6: Chart provided by http://www.chart.nu


Figure 7: Chart provided by http://www.chart.nu

Conclusion Both of these channeling techniques provide traders with a reliable way to locate breakout points and determine their scope. When using these patterns in conjunction with basic channeling rules, traders have access to a reliable and extremely versatile trading system to use in any market conditions.

Resources
Wolfe Wave (http://www.wolfewave.com) - The original discoverer of the Wolfe Wave channel pattern. Voodoo Trader (http://www.chart.nu) - Channels and chart signal identification for many stocks. ChartSetups LLC (http://www.chartsetups.com) - A stock signals provider utilizing advanced channeling patterns.

by Justin Kuepper,

Justin Kuepper has many years of experience in the market as an active trader and a personal retirement accounts manager. He spent a few years independently building and managing financial portals before obtaining his current position with Accelerized New Media, owner of SECFilings.com, ExecutiveDisclosure.com and other popular financial portals. Kuepper continues to write on a freelance basis, covering both finance and technology topics.

wolfe waves enable you to trade stock markets with incredible accuracy!

Wolfe Waves already found
2009 07 02 COP
2009 07 02 ADM
2009 07 02 MCD
2009 07 02 GDX
2009 07 02 GLD
2009 07 02 DIA
2009 07 02 QQQQ
2009 07 02 NUE
2009 07 02 AAPL
2009 07 02 SPY

free wolfe wave levels

to see wolfe waves for anything apart from the S&P, please login. If you don't have a login, signup! It's free, after all!

This site is nothing to do with the excellent wolfewave.com or it's owner, Mr Wolfe. Wolfe Wave is a trademark of Bill Wolfe. Wolfe waves have been around for many years, but they only came to prominence when Linda Raschke mentioned the pattern after a particularly good market call. In her book StreetSmarts, Linda reveals that she got the pattern from a good friend, Bill Wolfe, who has made a living trading the S&P using wolf waves for over a decade. A classic and truly excellent reversal pattern, wolf waves are also known as "3 pushes to a top/bottom" by Larry Pesavento, Jeff Cooper calls it the "Cooper 1-2-3 swing", and Linda Raschke likes to call it the "3 little indians". Whatever you call it, wolfe waves are a terrific setup, and here we are pleased to offer free charts to make identifying wolf waves easier for you.

Wolfe Waves Trading Pattern

Wolfe waves are trading patterns which occur naturally in all financial markets. Wolfe waves are considered as one of the most reliable trading pattern for finding the trends, supporting and resistance levels, possible equilibrium price range and the breakouts. Wolfe waves are created as a result of both short-term and long-term trading, as thus can be useful to any type of traders trading any product.


A five point wolfe wave is the complete wave consisting of 5 waves with equal time intervals and symmetry. A bearish trend consists of 3 bearish and 2 bullish trends and a bullish trend consists of 3 bullish and 2 bearish trends. The waves must fulfill certain regulations
  1. The range of wave 3-4 must equal to that of wave 1-2.
  2. There should be regular intervals between all waves.
  3. Waves 3 and 5 should show Fibonacci relationship (127% or 162%) with previous channel points.
  4. Wave 5 should extend beyond the trend line formed by wave 1 and 3.
The channel formed by the first three waves is the support and resistance levels. The point 5 is the breakout point and is the best time to buy or sell. The point six, which is derived by connecting the points 1 and 4 with the 5th wave; it is the most profitable position. Remember the success with wolfe wave depends on how accurately it is identified.

giovedì 2 luglio 2009

post

cxuvnj2834

domenica 30 marzo 2008

Wolfe Wave from Voodoo Trader


I was introduced to this setup back when Linda Raschke mentioned the pattern in a market call. Being the ever curious one, I found some additional references and examples in her book StreetSmarts, saying that "this particular methodology is perhaps the most unique, effective trading technique I've (Linda) ever came across! It was developed and shared by a good friend, Bill Wolfe, who for the last 10 years has made a living trading the S&P." The next jump lead to http://wolfewave.com/, an excellent source of information which was read, absorbed, and served as inspiration for use in the real world markets. Being very interested in reversal sequences, this approach appeals very much to my risk profile and trading style based on chart patterns (classic Edwards and Magee).The key to recognizing the setup is symmetry. Ideally, waves 1-3-5 are established with very regular timing intervals between moves. The other key ingredient is that the wave 4 should revisit the price range established by waves 1-2 for the best results. Another way to describe the pattern is that it comes as a rising wedge / channel in an uptrend, or falling wedge / channel in a downtrend. Wave 5 is often a false breakout move beyond the bounds of the pattern. Unlike either bull or bear flags, the movement is in the same direction as the overall trend, with the overlapping waves giving signals that an impending reversal is taking shape. This pattern has different names, depending on the source - Larry Pesavento describes the pattern as "3 pushes to a top/bottom" and uses Fibonacci relationships to confirm the setup (waves 3 and 5 are 127% or 162% extensions of the previous pullback.) Jeff Cooper uses "Cooper 1-2-3 swing" nomenclature, and Linda Raschke likes to call this setup "3 indians". The unique quality about wolfewaves, however, is the objective target projection from waves 1 -> 4. Despite the great explanation and examples provided on Bill Wolfe's site, I continue to get questions about how much I trust this setup. Very much so. The following are setups encountered over the years - most were called as wolfewaves right as the pattern was found, trade taken, and real money put to work to measure the risk and reward in real world cash. I hope these recent charts serve as inspiration for further study. Who needs bulls and bears when you can run with the wolfes? ES /Emini S&P Futures Contract Setup This gem was evolving into a rather frothy afternoon session in S&P trading. Note that is it very helpful to combine the setup evolution with other key support and resistance levels. In this case, a "measured move" completes around 902 and price action falls to test the lower bound of rising channel. The bounce sets up waves 1-4, and it is only a matter of patience to wait for the full pattern completion of wave #5 - a final stop/limit clearing move into close gives us the wolfewave setup.


Target Market opens up next morning at target juncture, and immediately reverses to retest the previous day's highs.


Wolfe Wave - What Does It Mean ?

In technical analysis, it is a naturally occurring trading pattern present in all financial markets. The pattern is composed of five waves showing supply and demand and a fight towards an equilibrium price. These patterns can develop over short- and long-term time frames such as minutes or weeks and are used to predict where a price is heading and when it will get there.

If identified correctly, Wolfe waves can be used to accurately predict the scope (equilibrium price) of the underlying security. To identify Wolfe waves, they must have the following characteristics:Waves 3-4 must stay within the channel created by 1-2Wave 1-2 equals waves 3-4 (shows symmetry)Wave 4 is within the channel created by waves 1-2There is regular time between all wavesWave 5 exceeds trendline created by waves 1 and 3 and is the entry pointThe estimated price is a price along the trendline created by waves 1 and 4 (point 6).